
Signature productLive demos
APxOps.
Continuous SAP
visibility.
Centralise critical SAP monitoring across system health, security and integrations — in one unified, near-real-time dashboard, with AI-assisted diagnostics on top.
MonitorsPerformanceSecurityIDocsJobsQueuesRFCsMemoryCPU
The hidden cost
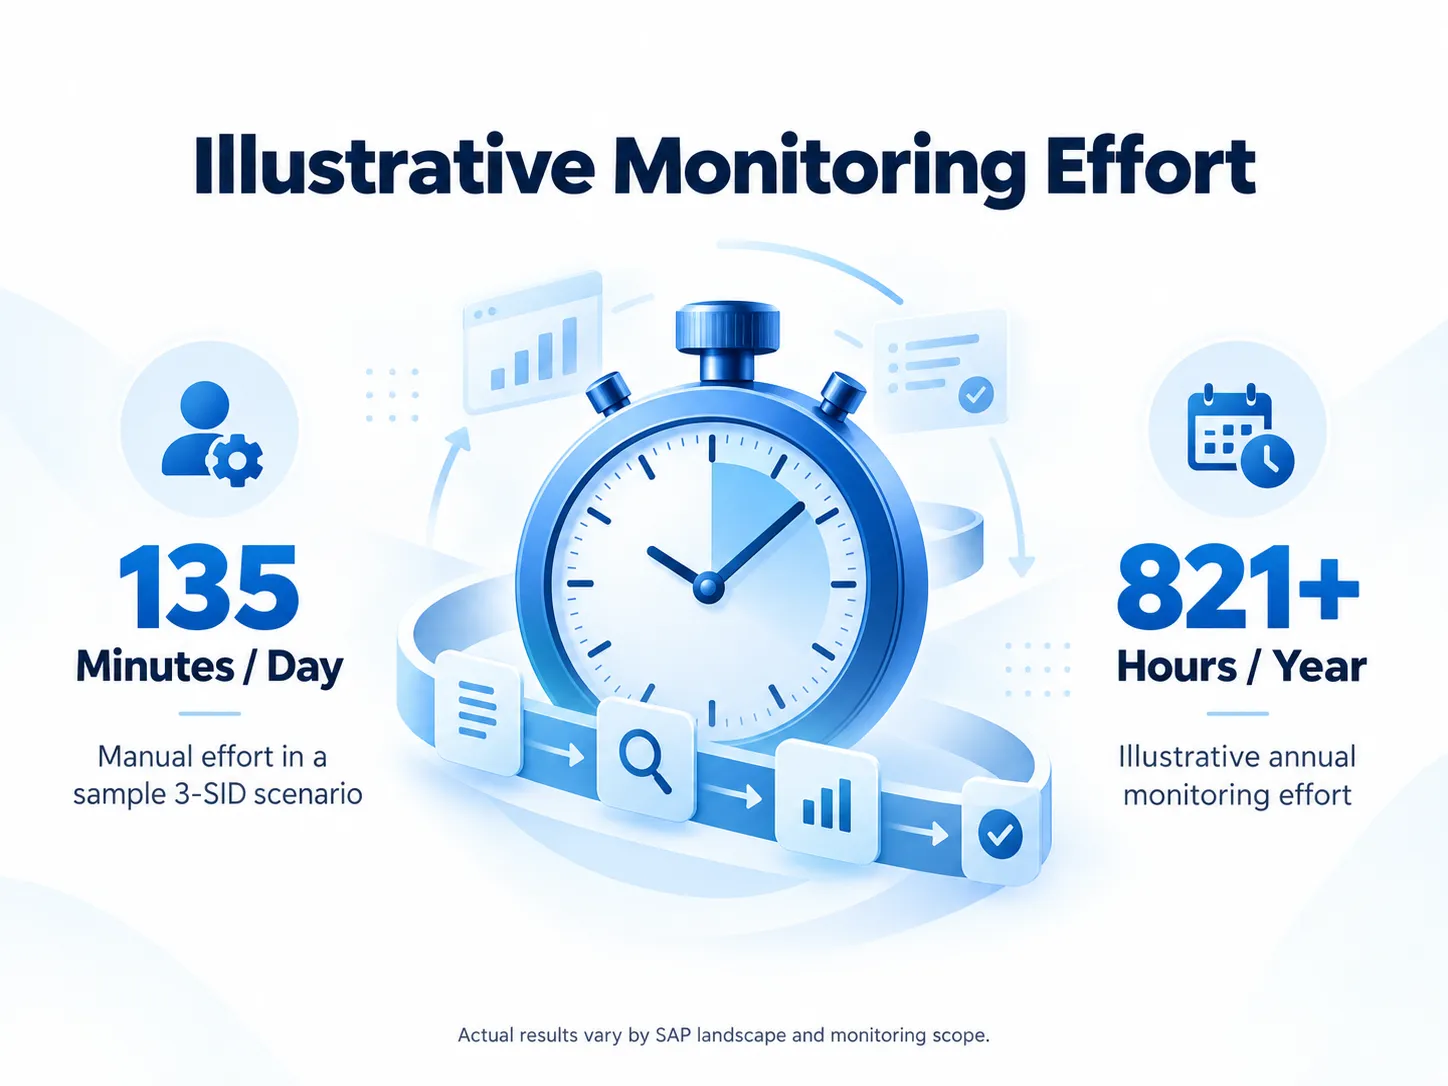
Manual Basis monitoring burns hundreds of hours a year
For a sample three-system landscape, a Basis engineer averages135 minutes a day on manual checks across SM12, SM13, SM21, SM37, ST03N, DB13 and friends — 821+ hours a yearof effort that APxOps automates away so the team is free for actual engineering work.
Actual results vary by SAP landscape and monitoring scope.
Complete visibility
Complete Visibility Across Your SAP Landscape
Centralise critical SAP monitoring across system health,security and integrations withnear-real-time visibility from one unified dashboard.
What APxOps delivers
- Automated Monitoring
- Flexible Deployment
- AI-Assisted Diagnostics
- Historical Insights
- Customizable Monitoring Views
- Threshold Alerts
Security & Access Intelligence
Integration & IDoc Health
The platform in use
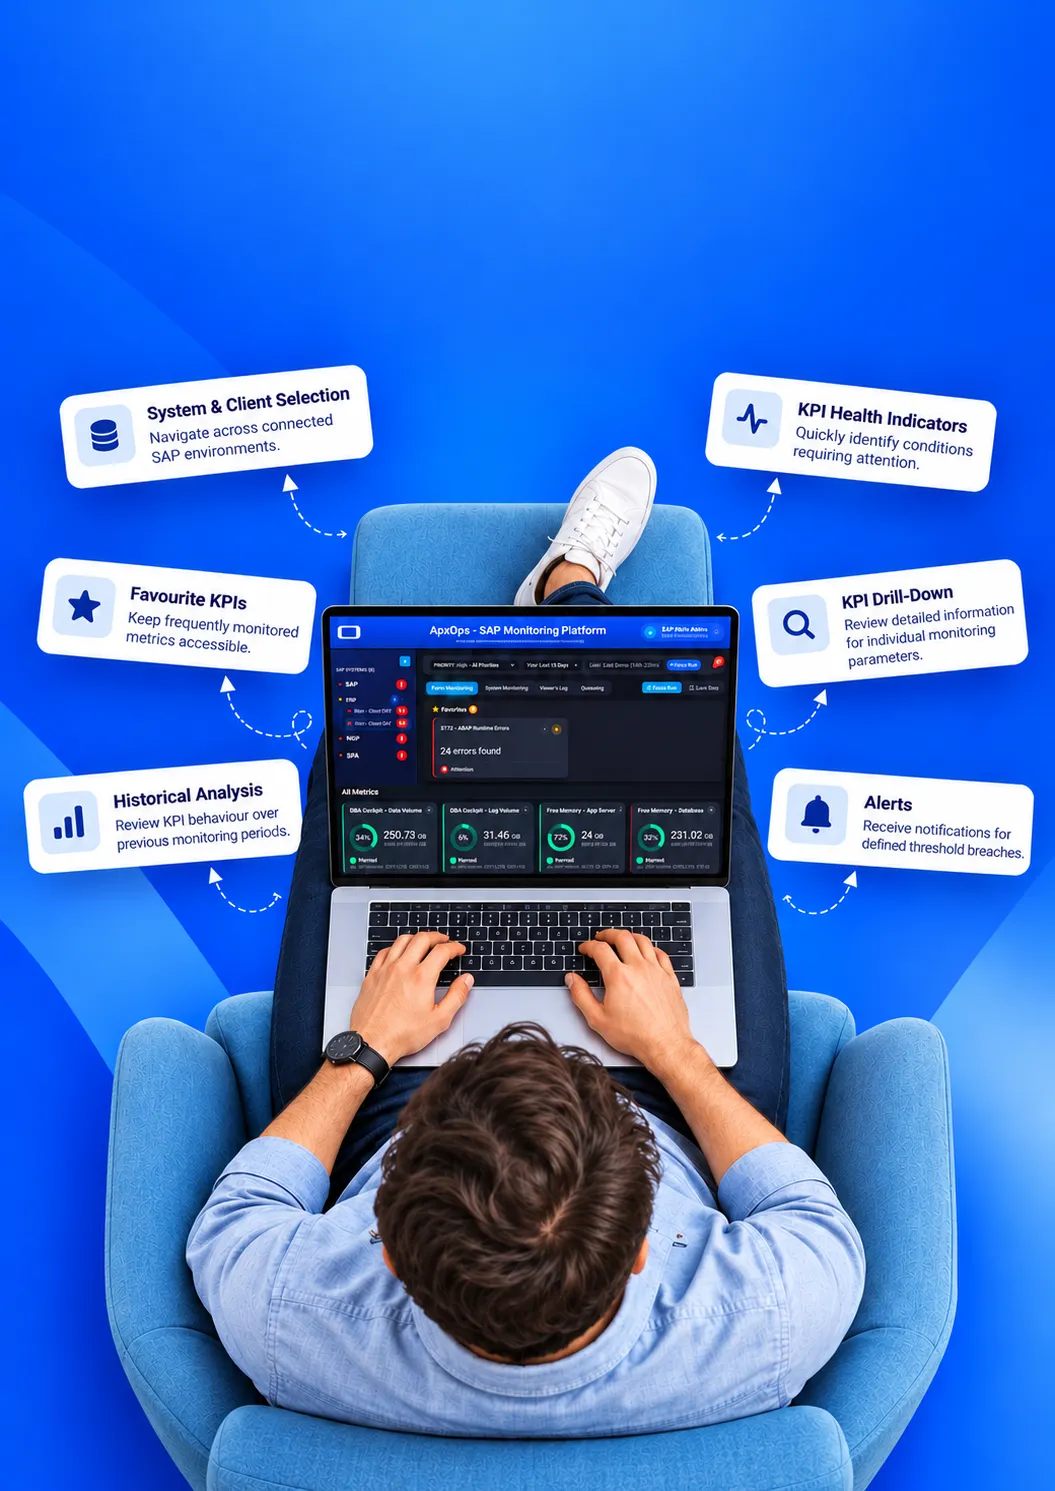
Six lenses on your landscape,one workbench
Pick a system and client, see KPI health at a glance, pin the KPIs that matter to you, drill down for root-cause, and get alerted on anything moving in the wrong direction.
Our signature product
APxOps —continuousSAP visibility.
Centralise system health, security and integrations in one unified dashboard. Near-real-time telemetry, threshold alerts and AI-assisted diagnostics across every SAP touchpoint you run.
System Performance & Basis Health
CPU, memory, database and queue telemetry — with threshold alerts and AI-assisted diagnostics on top.
- CPU
- Memory
- Database
- Queues
- Background jobs
- Locks
- Runtime errors
Security & Access Intelligence
Role, profile and privileged-access intelligence with historical insight — audit evidence without the lead time.
- Roles
- Access exceptions
- Profiles
- User activity
- Privileged access
Integration & IDoc Health
Inbound and outbound IDoc traffic, RFC health and queue depth — one place, not seven transactions.
- Processing errors
- RFCs
- Stuck IDocs
- Inbound IDocs
- Outbound IDocs
- Queue health
What APxOps delivers
- Automated monitoring
- Threshold alerts
- AI-assisted diagnostics
- Historical insights
- Customisable views
- Flexible deployment
What you get
Six capabilities,one surface area
Everything that makes APxOps worth running on your landscape — from the morning-sweep replacement to the audit-ready history.
See the whole landscape in one place
System health, security posture and integration flow — no more tab-hopping across SM50, STAD, SM13, SU01, WE05 and SMQ1.
Catch issues before users do
Threshold alerts and AI-assisted diagnostics push the signal — degrading jobs, climbing queue depth, suspicious logons — before someone opens a ticket.
Prove it with history
Trend charts across weeks and quarters — the numbers your audit, capacity planning and governance meetings always ask for.
AI diagnostics on tap
Correlate a spike in runtime errors with a background job, an IDoc stuck in a queue, or a permissions change — in plain English.
Deploy anywhere
Run on-premise, in your cloud tenant or hybrid. Agents are lightweight; the data stays in your control.
Customisable views
Build dashboards for the Basis engineer, the Security lead, the Integration owner and the CIO — all backed by the same data.
Who it's for
One platform,four audiences
Everyone whose job gets harder when SAP goes sideways — Basis, Security, Integration and leadership.
Basis & operations teams
Replaces the manual morning sweep across SM12, SM13, SM21, SM37, ST03N, DB13 and friends.
Security & GRC leads
Standing visibility of privileged access, role usage, SOD exceptions and failed logons — not a Q4 scramble before audit.
Integration owners
IDoc flow and queue depth across SAP ERP, PI/PO, Integration Suite and third-party systems — one monitor, every pipe.
CIO / IT leadership
Weekly trend view: incidents, auto-cleared alerts, mean-time-to-detect — numbers that make the quarterly steer-co useful.
Flexible deployment
Deploy the wayyour governance already allows
On-premise, in your cloud tenant, or hybrid — your data stays in your control, and the switch from one model to another is a configuration change, not a project.
01 · On premise
Full on-prem deployment
Runs inside your datacentre — zero outbound traffic required. The usual choice for defence and public-sector landscapes.
02 · Cloud
Hosted in your cloud tenant
Deploys into AWS, Azure or GCP under your account. We bring the installer and the operating model; you keep the keys.
03 · Hybrid
Hybrid — control plane in cloud, agents on-prem
A thin, read-only agent on the SAP side streams telemetry up to a cloud dashboard — minimal change-management overhead.
FAQ
Commonfirst questions
The ones that come up on nearly every demo call. If yours isn't here, it is on the demo request form below.
Does APxOps need agents on our SAP servers?
A lightweight read-only agent runs on each SAP server. It uses standard SAP RFC and OS APIs — no modifications to the SAP system itself.
What SAP versions are supported?
ECC 6.0 EHP6 and later, plus S/4HANA (on-premise and private cloud). SuccessFactors, Ariba and BTP monitoring are available as add-on packs.
How does the AI-assisted diagnostics work?
The platform correlates anomalies across metrics using statistical baselines and a small LLM layered on top of your historical telemetry — not a public model, not fed outside your tenant.
Can we run APxOps on top of our existing SolMan / Focused Run?
Yes. APxOps complements SolMan — it reads from the same sources but surfaces an actionable workbench rather than configuration-heavy views.
How is it priced?
Per SAP system monitored, with a flat band for landscapes above eight systems. The AI diagnostics layer is optional. Book a demo and we will quote on the actual landscape.
Request a live demo
See APxOps onyour landscape, your questions
Thirty minutes. We'll walk you through the three pillars, run a live diagnostic on a sample system, and quote against the landscape you describe.
- Live walk-through of all three pillars
- Technical Q&A with a Basis consultant
- Pricing against your actual landscape
More than monitoring
APxOps is one of eleven accelerators we have productised
If APxOps isn't quite the fit, there's a good chance one of our other solutions is — from AI user self-help bots to mass-upload tooling and automated ITSM incident creation.